
Joel Smith
Welcome to my website. Below, you can find links to my socials and resume, as well as projects I've worked on. Thanks for visiting!
Predicting Stock Price
Used Python, scikit-learn, Keras, and other data science packages to predict Amazon's stock price.
Predicting Amazon's Stock Price
Find the code used for this article here.
What is a stock, and why is it important?
Stock prices are crucial to companies and investors. But what is a stock? A stock is a small part of a company that is available for purchase, and its price is often a marker of how well the company is performing. If a company does not perform well financially, the stock price goes down, losing investors and stakeholders value in their portfolio. But if a company is very successful, the stock price will typically rise, netting investors more value and allowing them to sell their stocks for a profit.

What if we could predict the future price of a stock? While it’s impossible to predict the future with 100% accuracy, there are various technical markers that can be used to predict where stock prices will trend. Some of those markers include momentum, volatility, and volume (and many more which can be found here). If we can predict where stock prices will trend, then we can aid investors in their decision making process regarding purchasing or selling of their stocks.As a note, this project was inspired by Avery Smith and his Predicting Stock Prices article, which can be found here. Some of his code was reused in my project, including some of the helper functions and data cleaning.
Data
For this project, we’ll be predicting Amazon’s stock price. This data will be retrieved using yfinance, a Python library for retrieving stock information from Yahoo Finance. The data includes the date, open price, highest and lowest prices of the day, closing price, volume, dividends and stock splits.
Tools
Some of the tools used in this project include the basic Python data science package, including pandas and numpy. Additional libraries include ta, which is the library used to get the technical financial indicators, and fastai, which is used to add date information to our dataset, such as the year, month, and week, but also more specific things like if a date is the beginning of a quarter or not.For our prediction, we’ll be using scikit-learn. The machine learning models that will be used include the Linear Regression, MLP Regressor, Linear Support Vector Regressor, Random Forest Regressor, and K Nearest Neighbors Regressor. Details regarding these models and how they work can be found in the methods section near the end of this report.For our graphs and plotting, we’ll be using Plotly.
Results
For my training, I used a 75%/25% train/test split, meaning 75% of our data will be used to train the model while 25% of the data will be used to test it for accuracy and to see how well the model does on unseen data.. After doing initial testing, I then predicted the stock price 1 day out, 5 days out, 10 days out, and 20 days out. The results of the testing can be seen below.
Linear Regression and MLP Regressor Baselines
We will be using the Linear Regression and MLP Regressor models from Avery Smith’s article as a baseline to see how my models were able to improve. Below is a table with the R2 score and MSE of each model with the respective number of days that were predicted.
| Number of Days Out | Linear Regression R2 | Linear Regression MSE | MLP Regressor R2 | MLP Regressor MSE |
|---|---|---|---|---|
| 1 | 0.349 | 24.03 | 0.992 | 0.31 |
| 5 | -5.67 | 249.01 | 0.970 | 1.08 |
| 10 | -17.829 | 713.81 | 0.894 | 4.00 |
| 20 | -41.724 | 1,677.12 | 0.604 | 15.56 |
| Average | -16.219 | 665.99 | 0.865 | 5.24 |
Table 1: Linear Regression and MLP Regressor Performance
It is quite obvious that the MLP Regressor outperforms the Linear Regression model by a large margin. Let’s see if we can beat the MLP Regressor with some other kinds of machine learning models.
Linear Support Vector Regression
The Linear Support Vector Regression (SVR) proved to be very effective at estimating the future stock price. Using Scikit-learn’s LinearSVR model that was scaled using Scikit-learns’s StandardScaler, its performance matched or beat the MLP Regressor from our baseline.
| Number of Days Out | Linear SVR R2 | Linear SVR MSE |
|---|---|---|
| 1 | 0.993 | 0.266 |
| 5 | 0.970 | 1.114 |
| 10 | 0.913 | 3.280 |
| 20 | 0.694 | 12.018 |
| Average | 0.893 | 4.170 |
Table 2: Linear SVR Performance
As we can see, the Linear SVR model had a very good R2 score and MSE, both of which beat the MLP Regressor model.Below, we can see visualizations for how the Linear SVR performed as compared to test data.
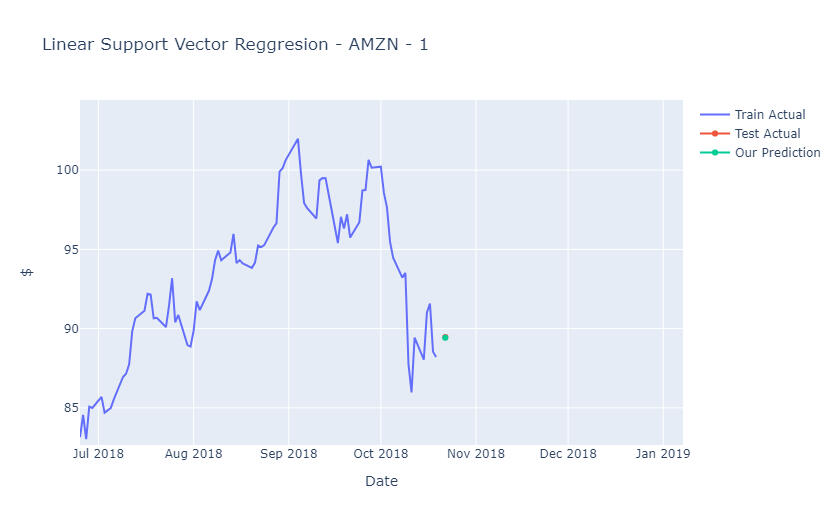
The Linear SVR’s prediction was nearly identical to the actual value for one day out
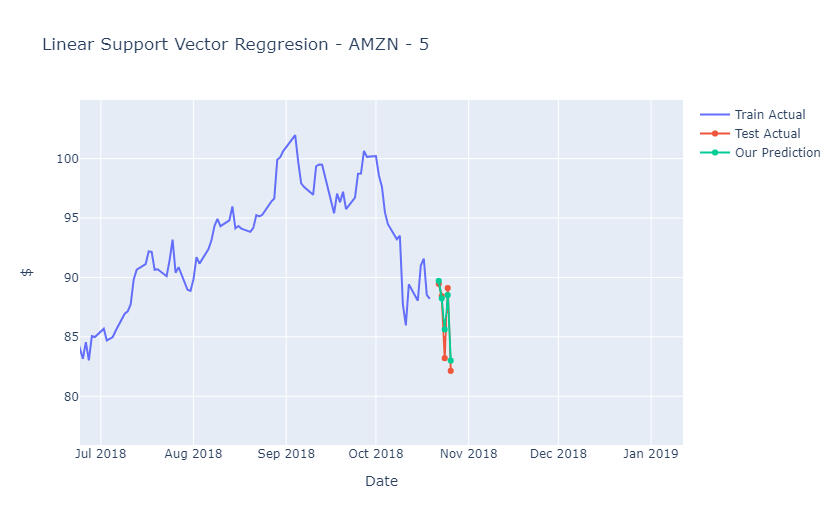
For five days out, the Linear SVR model followed the trends of the actual data perfectly, though it did miss the mark on the third day prediction, not falling as far as the actual price did.
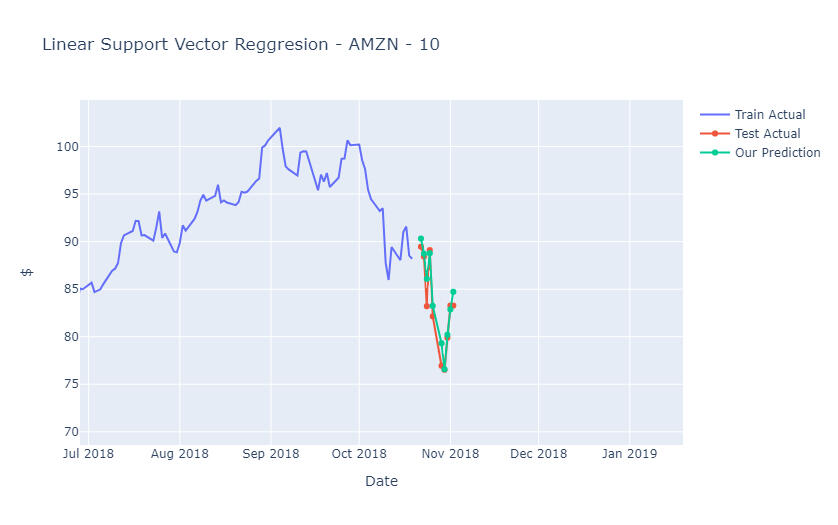
For ten days out, the Linear SVR model again performed very well. It was able to predict most of the day's closing price nearly perfectly.
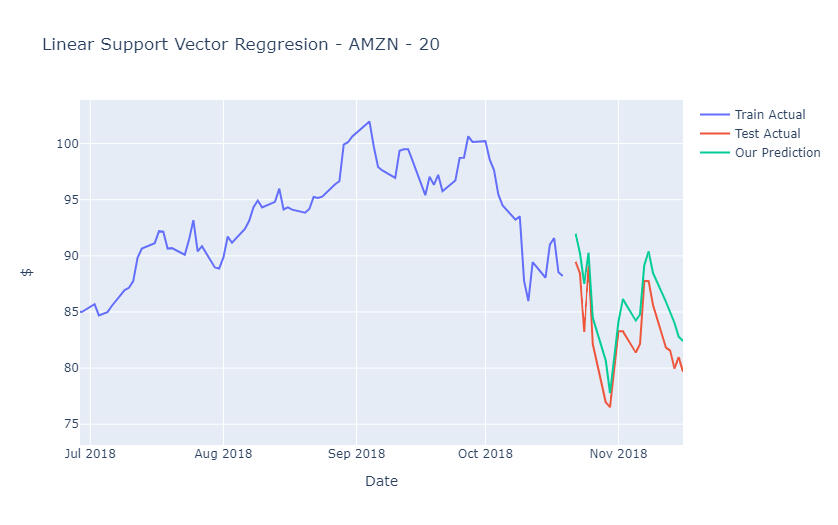
At twenty days out, this task becomes very difficult for almost all machine learning models, and we start to see some differences between the predicted values and actual values. However, the model did follow the trends fairly well, even if the specific values were not correct.
Random Forest Regressor
During training, the Random Forest Regressor consistently hovered around an R2 score of 0.30, which is lower than what I had hoped for. While the model did perform better on test data, it was still not able to match the MLP Regressor baseline model or the Linear SVR model.
| Number of Days Out | Random Forest Regressor R2 | Random Forest Regressor MSE |
|---|---|---|
| 1 | 0.509 | 18.194 |
| 5 | 0.392 | 22.701 |
| 10 | 0.344 | 24.872 |
| 20 | 0.310 | 27.094 |
| Average | 0.389 | 23.215 |
Table 3: Random Forest Regressor Performance